
LDAS products
ImagineS provides products derived from the regional LDAS operated over France by Meteo-France and over Hungary by OMSZ, and the global LDAS, operated by ECMWF over the globe. They are presented in the ATBD, and are provided in ASCII csv format files. All practical information are given in the Product User Manual. They are all freely accessible on the ImagineS ftp: you can get the access information after registration.
|
The global LDAS products are calculated over 85 sites of crops and grassland scattered around the globe. They include a set of variables derived from the analysis i.e. the land surface model simulation after the assimilation of satellite-derived products. For each site, the daily and the 10-daily products are sets of 21 files corresponding to:
|
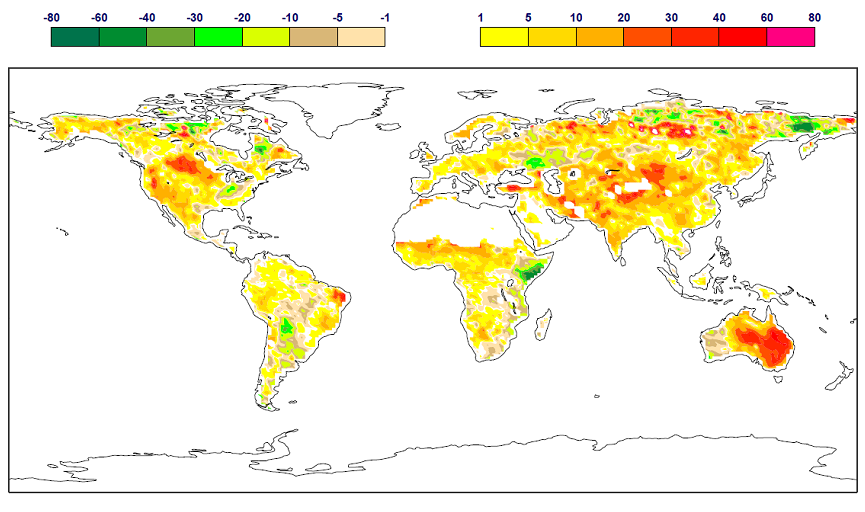
Above Ground Biomass-based Anomaly Index for November 2010 in % of the 1999-2013 mean |
The regional LDAS products are calculated for 45 straw cereal sites and 48 grassland sites in France, and for 9 straw cereal sites in Hungary. They include:
- daily time series of Leaf Area Index (LAI), root zone soil moisture (SWI), evapotranspiration, Net Ecosystem Exchange (NEE), Gross Primary Production (GPP), and Above Ground Biomass (AGB) anomaly (% difference w.r.t. the 2008-2013 mean at the same date)
- 10-daily time series of drought indicators. A drought indicator is a scaled anomaly index of a variable for a particular 10-day period (from January to December) with regard to its standard deviation over the 2008-2013 period. The variables are the LAI, the SWI and the AGB.
|
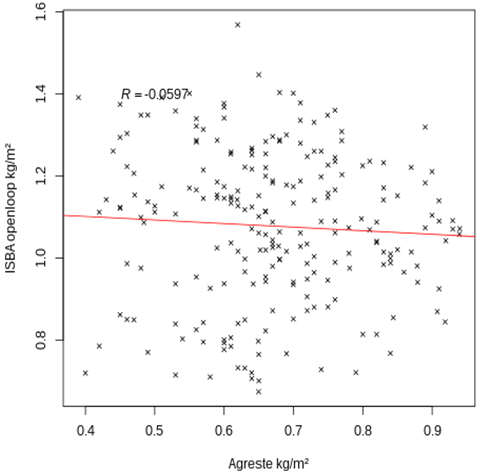
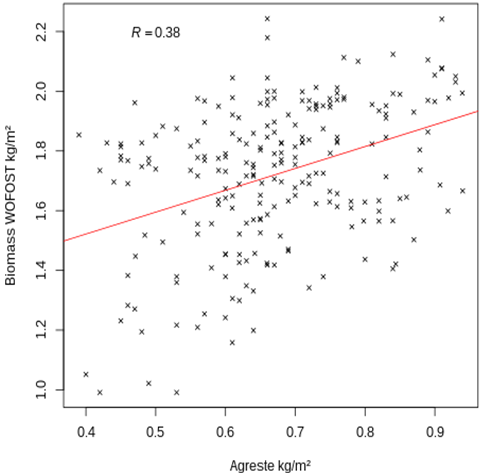
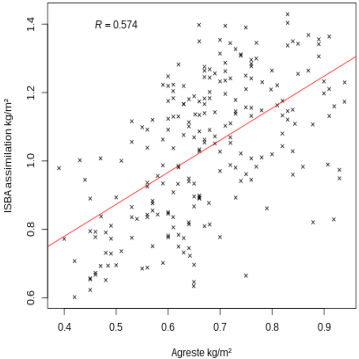
The added value of the assimilation of satellite products on vegetation biomass simulations is evaluated over France using reference agricultural yearly statistics of fodder production and straw cereal yields ( Agreste), and compared to the output of the WOFOST model implemented currently within the MARS Crop Growth Monitoring System of JRC. The assimilation of LAI triggers a dramatic improvement of the correlation between the simulated biomass and the observations, and the ImagineS regional LDAS outperforms the WOFOST model. Further Details are given in the Validation Report over France. Similar comparisons have been performed over Hungary. The results are given in the Validation Report over Hungary. |
Simulated above-ground biomass (kg.m-2) of straw cereals vs Agreste statistics of yield, over 45 administrative units in France for a 5-year period (2007-2011). From left to right: LDAS without assimilation, WOFOST output, LDAS with assimilation |
At global scale, it is shown that the LDAS is able to better capture and monitor extreme events and that the assimilation of LAI has a positive impact on surface fluxes and near surface atmospheric variables. Details are given in the Validation Report over the Globe.